
Published on November 5, 2010
By Leeroy Wilfred Kabs-Kanu :
The dramatic socio-economic and political turnaround brought about in Sierra Leone by President Ernest Koroma ‘s Agenda For Change has started reaping rich dividends. The 2010 Human Development Index Report launched at the United Nations today saw Sierra Leone impressively moving up the ladder from 167 to 158 in another undeniable indication that the All People’s Congress ( APC ) Government has succeeded in improving the quality of life of Sierra Leone, even though many challenges remain for the nation, which is still recovering from one of the bloodiest and most destructive wars in human history .
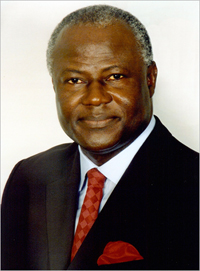
PRESIDENT ERNEST KOROMA
Since the annual report was first launched in 1990, Sierra Leone had been at the very bottom of the index for most time year by year , adjudged indeed as the poorest nation on the face of the earth or the least developed nation in the world. This was a stigma too bitter to bear , though it was not all that surprising , because during the 11 year devastating war, all the country’s infrastructure were destroyed and the means of life of the people demolished. The setback was also the result of bad governance and neglect of development initiatives, corruption and indolence by governments that had ruled the nation since Independence. Year in , year out Sierra Leoneans had to endure the pain and humiliation of the HDI rating their country as the most backward in the world.
However , in 2005, one man stood up and vowed that if he was voted President in the 2007 General Elections , he would change the situation. A then young insurance executive , Ernest Bai Koroma promised the Sierra Leonean people that he will provide committed and progressive leadership and will initiate development programs that will move Sierra Leone from the bottom of the UN Human Development Index.
As God would have it, Mr. Koroma won the 2007 Presidential elections and his party captured most of the seats in the Legislative polls held simultaneously. Hardly had he mounted the presidential stage when Sierra Leone’s new, dynamic and politically brilliant leader set the machinery in motion to effect change in the lives of the suffering people. He launched the AGENDA FOR CHANGE, an ambitious socio-economic and political development program ,which was Sierra Leone’s Second Poverty Reduction Strategy .In the preface of Agenda’s booklet, President Koroma explained : Since my government took office in 2007, we have strived to chart a bold new path for accelerating the advancement of our country on all fronts. Our vision and strategies are articulated in my ‘Agenda For Change’ …The Agenda For Change reflects our people’s belief that the government they elected in a free and fair election will work in partnership with them to improve their social and economic conditions. “
The clever politician , who is also good in the areas of economics and business as a well-trained and experience insurance executive , President Koroma based his Agenda For Change on four key priorities –The provision of reliable power supply , raising quantity and value-added productivity in agriculture and fisheries; improving the national transportation network to enable the movement of people and goods and fourth ensuring sustainable human development through the provision of improved social services.
In just three years, the President’s Agenda For Change has brought a fascinating turn around in the socio-economic and political fortunes of Sierra Leone. With electricity being provided in 90 days, followed by the completion of the Bumbuna Hydroelectricity dam, the President embarked on road development projects, accelerating food production through the provision of tractors and advance farming implements as well as making agriculture profitable .Not only that, the government went all out to improve health care delivery services in the country by improving the salaries and conditions of service of doctors, nurses and health care personnel , building new clinics and upgrading hospitals and other health facilities. Essential drugs were also made available and this year, the President launched his free health insurance scheme for pregnant women, lactating mothers and children under 5. The government has also revived mining activities throughout the country. The result of all this transformation is that Sierra Leone is no longer among the 10 least developed nations in the world. At 158, there is still much room for development but a UN official told me today that President Koroma has provided the enabling environment for Sierra Leone to move even further up the human development index.
In just three years, the President’s Agenda For Change has brought a fascinating turn around in the socio-economic and political fortunes of Sierra Leone. With electricity being provided in 90 days, followed by the completion of the Bumbuna Hydroelectricity dam, the President embarked on road development projects, accelerating food production through the provision of tractors and advance farming implements as well as making agriculture profitable .Not only that, the government went all out to improve health care delivery services in the country by improving the salaries and conditions of service of doctors, nurses and health care personnel , building new clinics and upgrading hospitals and other health facilities. Essential drugs were also made available and this year, the President launched his free health insurance scheme for pregnant women, lactating mothers and children under 5. The government has also revived mining activities throughout the country. The result of all this transformation is that Sierra Leone is no longer among the 10 least developed nations in the world. At 158, there is still much room for development but a UN official told me today that President Koroma has provided the enabling environment for Sierra Leone to move even further up the human development index.
The Human Development Index was devised by the UN to “assess comparative levels of development in countries. Its three main matrices are literacy, life expectancy, and purchasing power parity (PPP)-adjusted income.” It is also a ”measure of human development using three equally weighted dimensions of human development – life expectancy at birth, adult literacy and mean years of schooling and income (purchasing power per capita in dollars).” Countries behind Sierra Leone in the order of the positions are the Central African Republic, Mali, Burkina Faso, Liberia, Chad, Guinea-Bissau, Mozambique, Burundi, Niger, Democratic Republic of the Congo and Zimbabwe.
This is an achievement that should make every patriot in whose veins run the true Sierra Leonean blood very happy and proud . This achievement , coming at the heels of other commendable showings in the Mo Ibrahim Index on Governance , the Transparency International Corruption Index and the index on Doing Business , effectively reinforces what the International Community and stakeholders have been saying all along during UN meetings and conferences that President Ernest Koroma is performing above expectation.
Nobody is saying that all is now very rosy in Sierra Leone and that we should rest on our oars . This is far from what is being said here . Challenges still remain in areas like youth employment and keeping prices of basic commodities stable but the HDI Report also reinforces what all reasonable Sierra Leoneans believe that the Government has taken a gigantic step to address these challenges and should be given chance to continue its socio-economic and political reforms . At least, the government has demonstrated that it is very committed and has the capacity to steer Sierra Leone back to her old glory. This has nothing to do with partisan politics but the interest of the nation. If President Koroma is given the chance, Sierra Leoneans will reap the rich dividends of his socio-economic and political developments.
HERE IS THE FULL STATISTICS OF THE REPORT RELEASED TODAY :
HDI Value Life expectancy Mean years of schooling Expected years of schooling GNI GNI Capital rank NI Value
HDI Value Life expectancy Mean years of schooling Expected years of schooling GNI GNI Capital rank NI Value
1 Norway 0.938 81.0 12.6 17.3 58,810 2 0.954
2 Australia 0.937 81.9 12.0 20.5 38,692 11 0.989
3 New Zealand 0.907 80.6 12.5 19.7 25,438 30 0.979
4 United States 0.902 79.6 12.4 15.7 47,094 5 0.917
5 Ireland 0.895 80.3 11.6 17.9 33,078 20 0.936
6 Liechtenstein 0.891 79.6 c 10.3 d 14.8 81,011 e,f –5 0.861
7 Netherlands 0.890 80.3 11.2 16.7 40,658 4 0.911
8 Canada 0.888 81.0 11.5 16.0 38,668 6 0.913
9 Sweden 0.885 81.3 11.6 15.6 36,936 8 0.911
10 Germany 0.885 80.2 12.2 15.6 35,308 9 0.915
11 Japan 0.884 83.2 11.5 15.1 34,692 11 0.915
12 Korea, Republic of g 0.877 79.8 11.6 16.8 29,518 16 0.918
13 Switzerland 0.874 82.2 10.3 15.5 39,849 –1 0.889
14 France 0.872 81.6 10.4 16.1 34,341 9 0.898
15 Israel 0.872 81.2 11.9 15.6 27,831 14 0.916
16 Finland 0.871 80.1 10.3 17.1 33,872 8 0.897
17 Iceland 0.869 82.1 10.4 18.2 22,917 20 0.928
18 Belgium 0.867 80.3 10.6 15.9 34,873 3 0.888
19 Denmark 0.866 78.7 10.3 16.9 36,404 –1 0.883
20 Spain 0.863 81.3 10.4 16.4 29,661 6 0.897
21 Hong Kong, China (SAR) 0.862 82.5 10.0 13.8 45,090 –11 0.860
22 Greece 0.855 79.7 10.5 16.5 27,580 8 0.890
23 Italy 0.854 81.4 9.7 16.3 29,619 4 0.882
24 Luxembourg 0.852 79.9 10.1 13.3 51,109 –18 0.836
25 Austria 0.851 80.4 9.8 15.0 37,056 –9 0.859
26 United Kingdom 0.849 79.8 9.5 15.9 35,087 –6 0.860
27 Singapore 0.846 80.7 8.8 14.4 h 48,893 –19 0.831
28 Czech Republic 0.841 76.9 12.3 15.2 22,678 10 0.886
29 Slovenia 0.828 78.8 9.0 16.7 25,857 3 0.853
30 Andorra 0.824 80.8 c 10.4 i 11.5 38,056 j,k –15 0.817
31 Slovakia 0.818 75.1 11.6 14.9 21,658 12 0.854
32 United Arab Emirates 0.815 77.7 9.2 11.5 58,006 –28 0.774
33 Malta 0.815 80.0 9.9 14.4 21,004 l 11 0.850
34 Estonia 0.812 73.7 12.0 15.8 17,168 13 0.864
35 Cyprus 0.810 80.0 9.9 13.8 21,962 6 0.840
36 Hungary 0.805 73.9 11.7 15.3 17,472 10 0.851
37 Brunei Darussalam 0.805 77.4 7.5 14.0 49,915 –30 0.769
38 Qatar 0.803 76.0 7.3 12.7 79,426 m –36 0.737
39 Bahrain 0.801 76.0 9.4 14.3 26,664 –8 0.809
40 Portugal 0.795 79.1 8.0 15.5 22,105 0 0.815
41 Poland 0.795 76.0 10.0 15.2 17,803 4 0.834
42 Barbados 0.788 77.7 9.3 13.4 n 21,673 0 0.806
HIGH HUMAN DEVELOPMENT
43 Bahamas 0.784 74.4 11.1 b,o 11.6 25,201 p –9 0.788
44 Lithuania 0.783 72.1 10.9 16.0 14,824 7 0.832
45 Chile 0.783 78.8 9.7 14.5 13,561 11 0.840
46 Argentina 0.775 75.7 9.3 15.5 14,603 6 0.821
47 Kuwait 0.771 77.9 6.1 12.5 55,719 –42 0.714
48 Latvia 0.769 73.0 10.4 15.4 12,944 13 0.822
49 Montenegro 0.769 74.6 10.6 b,q 14.4 h 12,491 16 0.825
50 Romania 0.767 73.2 10.6 14.8 12,844 13 0.820
51 Croatia 0.767 76.7 9.0 13.8 16,389 –2 0.798
52 Uruguay 0.765 76.7 8.4 15.7 13,808 3 0.810
53 Libyan Arab Jamahiriya 0.755 74.5 7.3 16.5 17,068 –5 0.775
54 Panama 0.755 76.0 9.4 13.5 13,347 4 0.796
55 Saudi Arabia 0.752 73.3 7.8 13.5 24,726 –20 0.742
56 Mexico 0.750 76.7 8.7 13.4 13,971 –3 0.785
57 Malaysia 0.744 74.7 9.5 12.5 13,927 –3 0.775
58 Bulgaria 0.743 73.7 9.9 13.7 11,139 10 0.795
59 Trinidad and Tobago 0.736 69.9 9.2 11.4 24,233 –23 0.719
60 Serbia 0.735 74.4 9.5 13.5 10,449 11 0.788
61 Belarus 0.732 69.6 9.3 b,q 14.6 12,926 1 0.763
62 Costa Rica 0.725 79.1 8.3 11.7 10,870 7 0.768
63 Peru 0.723 73.7 9.6 13.8 8,424 14 0.788
64 Albania 0.719 76.9 10.4 11.3 7,976 19 0.787
65 Russian Federation 0.719 67.2 8.8 14.1 15,258 –15 0.729
66 Kazakhstan 0.714 65.4 10.3 15.1 10,234 6 0.756
67 Azerbaijan 0.713 70.8 10.2 b,o 13.0 8,747 8 0.769
68 Bosnia and Herzegovina 0.710 75.5 8.7 b,q 13.0 8,222 12 0.771
69 Ukraine 0.710 68.6 11.3 14.6 6,535 20 0.794
70 Iran, Islamic Republic of 0.702 71.9 7.2 14.0 11,764 –3 0.725
71 The former Yugoslav Republic of Macedonia 0.701 74.5 8.2 12.3 9,487 3 0.742
72 Mauritius 0.701 72.1 7.2 13.0 13,344 –13 0.712
73 Brazil 0.699 72.9 7.2 13.8 10,607 –3 0.728
74 Georgia 0.698 72.0 12.1 b,q 12.6 4,902 26 0.805
75 Venezuela, Bolivarian Republic of 0.696 74.2 6.2 14.2 11,846 –9 0.716
76 Armenia 0.695 74.2 10.8 11.9 5,495 19 0.787
77 Ecuador 0.695 75.4 7.6 13.3 7,931 7 0.749
78 Belize 0.694 76.9 9.2 12.4 5,693 16 0.782
79 Colombia 0.689 73.4 7.4 13.3 8,589 –3 0.732
80 Jamaica 0.688 72.3 9.6 11.7 7,207 6 0.748
81 Tunisia 0.683 74.3 6.5 14.5 7,979 1 0.729
82 Jordan 0.681 73.1 8.6 13.1 5,956 10 0.755
83 Turkey 0.679 72.2 6.5 11.8 13,359 –26 0.679
84 Algeria 0.677 72.9 7.2 12.8 8,320 –6 0.716
85 Tonga 0.677 72.1 10.4 13.7 4,038 23 0.792
MEDIUM HUMAN DEVELOPMENT
86 Fiji 0.669 69.2 11.0 13.0 4,315 21 0.771
87 Turkmenistan 0.669 65.3 9.9 b,o 13.0 h 7,052 1 0.719
88 Dominican Republic 0.663 72.8 6.9 11.9 8,273 –9 0.695
89 China 0.663 73.5 7.5 11.4 7,258 –4 0.707
90 El Salvador 0.659 72.0 7.7 12.1 6,498 0 0.711
91 Sri Lanka 0.658 74.4 8.2 12.0 4,886 10 0.738
92 Thailand 0.654 69.3 6.6 13.5 n 8,001 –11 0.683
93 Gabon 0.648 61.3 7.5 12.7 12,747 –29 0.637
94 Suriname 0.646 69.4 7.2 b,q 12.0 7,093 –7 0.681
95 Bolivia, Plurinational State of 0.643 66.3 9.2 13.7 4,357 11 0.724
96 Paraguay 0.640 72.3 7.8 12.0 4,585 9 0.714
97 Philippines 0.638 72.3 8.7 11.5 4,002 12 0.726
98 Botswana 0.633 55.5 8.9 12.4 13,204 –38 0.613
99 Moldova, Republic of 0.623 68.9 9.7 12.0 3,149 19 0.729
100 Mongolia 0.622 67.3 8.3 13.5 3,619 12 0.710
101 Egypt 0.620 70.5 6.5 11.0 5,889 –8 0.657
102 Uzbekistan 0.617 68.2 10.0 b,q 11.5 3,085 17 0.721
103 Micronesia, Federated States of 0.614 69.0 8.8 b,o 11.7 r 3,266 s 13 0.709
104 Guyana 0.611 67.9 8.5 12.2 3,302 11 0.702
105 Namibia 0.606 62.1 7.4 11.8 6,323 –14 0.629
106 Honduras 0.604 72.6 6.5 11.4 3,750 5 0.676
107 Maldives 0.602 72.3 4.7 12.4 5,408 –11 0.636
108 Indonesia 0.600 71.5 5.7 12.7 3,957 2 0.663
109 Kyrgyzstan 0.598 68.4 9.3 12.6 2,291 17 0.726
110 South Africa 0.597 52.0 8.2 13.4 9,812 –37 0.581
111 Syrian Arab Republic 0.589 74.6 4.9 10.5 r 4,760 –9 0.627
112 Tajikistan 0.580 67.3 9.8 11.4 2,020 22 0.709
113 Viet Nam 0.572 74.9 5.5 10.4 2,995 7 0.646
114 Morocco 0.567 71.8 4.4 10.5 4,628 –10 0.594
115 Nicaragua 0.565 73.8 5.7 10.8 2,567 7 0.652
116 Guatemala 0.560 70.8 4.1 10.6 4,694 –13 0.583
117 Equatorial Guinea 0.538 51.0 5.4 b,q 8.1 22,218 –78 0.454
118 Cape Verde 0.534 71.9 3.5 b,o 11.2 3,306 –4 0.573
119 India 0.519 64.4 4.4 10.3 3,337 –6 0.549
120 Timor-Leste 0.502 62.1 2.8 b,o 11.2 5,303 –23 0.485
121 Swaziland 0.498 47.0 7.1 10.3 5,132 –23 0.482
122 Lao People’s Democratic Republic 0.497 65.9 4.6 9.2 2,321 3 0.548
123 Solomon Islands 0.494 67.0 4.5 b,o 9.1 2,172 6 0.550
124 Cambodia 0.494 62.2 5.8 9.8 1,868 12 0.566
125 Pakistan 0.490 67.2 4.9 6.8 2,678 –4 0.523
126 Congo 0.489 53.9 5.9 9.3 3,258 –9 0.503
127 São Tomé and Príncipe 0.488 66.1 4.2 b,o 10.2 1,918 8 0.553
LOW HUMAN DEVELOPMENT
128 Kenya 0.470 55.6 7.0 9.6 1,628 10 0.541
129 Bangladesh 0.469 66.9 4.8 8.1 1,587 12 0.543
130 Ghana 0.467 57.1 7.1 9.7 1,385 14 0.556
131 Cameroon 0.460 51.7 5.9 9.8 2,197 –3 0.493
132 Myanmar 0.451 62.7 4.0 9.2 1,596 8 0.511
133 Yemen 0.439 63.9 2.5 8.6 2,387 –9 0.453
134 Benin 0.435 62.3 3.5 9.2 1,499 8 0.491
135 Madagascar 0.435 61.2 5.2 b,o 10.2 953 22 0.550
136 Mauritania 0.433 57.3 3.7 8.1 2,118 –5 0.454
137 Papua New Guinea 0.431 61.6 4.3 5.2 2,227 –10 0.447
138 Nepal 0.428 67.5 3.2 8.8 1,201 12 0.506
139 Togo 0.428 63.3 5.3 9.6 844 22 0.557
140 Comoros 0.428 66.2 2.8 b,o 10.7 1,176 12 0.507
141 Lesotho 0.427 45.9 5.8 10.3 2,021 –8 0.448
142 Nigeria 0.423 48.4 5.0 b,q 8.9 2,156 –12 0.436
143 Uganda 0.422 54.1 4.7 10.4 1,224 5 0.491
144 Senegal 0.411 56.2 3.5 7.5 1,816 –7 0.433
145 Haiti 0.404 61.7 4.9 6.8 n 949 13 0.493
146 Angola 0.403 48.1 4.4 b,o 4.4 4,941 –47 0.353
147 Djibouti 0.402 56.1 3.8 b,q 4.7 2,471 –24 0.394
148 Tanzania, United Republic of 0.398 56.9 5.1 5.3 1,344 –1 0.441
149 Côte d’Ivoire 0.397 58.4 3.3 6.3 1,625 –10 0.420
150 Zambia 0.395 47.3 6.5 7.2 1,359 –5 0.434
151 Gambia 0.390 56.6 2.8 8.6 1,358 –5 0.426
152 Rwanda 0.385 51.1 3.3 10.6 1,190 –1 0.432
153 Malawi 0.385 54.6 4.3 8.9 911 6 0.463
154 Sudan 0.379 58.9 2.9 4.4 2,051 –22 0.373
155 Afghanistan 0.349 44.6 3.3 8.0 1,419 –12 0.358
156 Guinea 0.340 58.9 1.6 b,t 8.6 953 0 0.380
157 Ethiopia 0.328 56.1 1.5 b,o 8.3 992 –2 0.357
158 Sierra Leone 0.317 48.2 2.9 7.2 809 4 0.360
159 Central African Republic 0.315 47.7 3.5 6.3 758 4 0.363
160 Mali 0.309 49.2 1.4 8.0 1,171 –7 0.312
161 Burkina Faso 0.305 53.7 1.3 b,q 5.8 1,215 –12 0.303
162 Liberia 0.300 59.1 3.9 11.0 320 5 0.509
146 human development report 2010
2010 2010 2010 2010b 2010 2010 2010
163 Chad 0.295 49.2 1.5 b,o 6.0 1,067 –9 0.298
164 Guinea-Bissau 0.289 48.6 2.3 b,q 9.1 538 1 0.362
165 Mozambique 0.284 48.4 1.2 8.2 854 –5 0.300
166 Burundi 0.282 51.4 2.7 9.6 402 0 0.400
167 Niger 0.261 52.5 1.4 4.3 675 –3 0.285
168 Congo, Democratic Republic of the 0.239 48.0 3.8 7.8 291 0 0.390
169 Zimbabwe 0.140 47.0 7.2 9.2 176 0 0.472
Leeroy Wilfred Kabs-Kanu
Minister Plenipotentiary
Permanent Mission of Sierra Leone to the UN
245 E 49th Street, New York, NY 10017
Tel: (212 ) 688 – 1656 Ext. 18

Leave a Reply